Showing posts with label Google Analytics. Show all posts

Monday, July 9, 2012

PUMA Uses Google Analytics to Kick Up Orders


Web analytics, as we know it, is part of every digital marketer’s arsenal of tools. If it’s not, then s/he is not a real digital marketer. Companies are investing more resources – both human and technological – to get actionable information from web data.

According to eConsultancy, roughly 48 percent of companies who responded to the Online Measurement and Strategy Report 2010 are planning to increase the number of employees they have dedicated to web data analysis ("Companies spending more," 2010).

What’s even more assuring is that “87% of companies surveyed are using Google Analytics for online measurement. Of these firms, 38% are now using this tool exclusively, while 49% are using it alongside along with another measurement tool” ("Companies spending more," 2010).

That said, I thought it would prove useful to review how a big name brand leverages Google Analytics (GA) for its insight. Thankfully, Google provides a repository of case studies on some of the biggest name brands on the market.

PUMA Integrates Google Analytics, Increases Order Rate by 7 Percent

According to the Puma case study provided by Google, the brand’s goals were simply (Puma kicks up, 2011):
  • Gain insights into content and product popularity to drive strategy
  • Understand which content is engaging customers and contributing to sales within each region
  • Improve conversion and customer experience online by optimizing the web site
Puma’s primary challenge was to keep up with an evolving market just as fast as its products are evolving across various product categories. Its global reach also presented a challenge since engagement varies depending on the geographic region. In other words, they want to keep a unified and distinct web presence no matter what part of the world visitors are viewing the website from, or what product categories visitors are interested in (i.e., PUMA Running, Golf, Football).

PUMA Overcomes Challenges With Google Analytics, Viget

It doesn’t take long for brands as big as PUMA to make a change and see results. With the help of Viget, an agency that develops digital products, they created the right formula for success.
Through Custom Variables in GA, which segmented visitors based on test variations, PUMA compared “how each test variation affected visitor ability to complete a variety of goals and the micro-conversions along the way”. 

But the web analysis didn’t stop there. The brand used profiles and filters to create a 360-degree picture of PUMA.com as well as separate, targeted views of each category site. To gather further insight into the behaviors visitors were having with the site, PUMA developed Event Tracking to measure interactions with dynamic page elements (i.e., social sharing widgets, search boxes, multimedia) and Advanced Segments to track how visitors from various regions interact with the PUMA site.

Making Something Out of Web Metrics

The data digital marketers gather is only useful when put into use. Through testing various website elements, a variation was found that “increased online orders by 7.1 percent”, according to the case study. When coupled with other insights from GA that led to changes to the website, the results have led to more than twice the amount of time visitors spend interacting with PUMA brand content (news, videos, images, etc.). PUMA has also experienced “47% more traffic from growing regions such as China and India.”

What About Social Media Metrics?

Every marketer faces a challenging question on a daily basis: What else can I do? In truth, there’s always something. Without knowing the full details of what other tools and metrics Viget provided PUMA with, I recommend applying a variety of social media monitoring tools that can be coupled with its current website analytics monitoring efforts. 

I will be the first to say that I love it when Google comes up with new tools to track even more aspects of the behavior between a website and its audience. The following is a slew of features Google has given us, known as Social Interaction Analytics, which can be found on GA.

  • Tracking Social Actions: Through the use of simple code, every social action (likes, tweets, shares, pins, +1, etc.) can be tracked in order to measure and compare what social actions PUMA’s audience prefers, as well as which pages receives the most social actions.
  • Monetizing Social Actions: Of course, every brand wants to see the “ROI of social media”. GA provides conversion reports that enable social media marketing accountability. In other words, the report shows conversion rates and monetary value of conversions that occurred due to visits from social networks.
  • Knowing Which Social Networks Provides High-Quality Traffic: Inclusive of the aforementioned are other components of tracking social with GA.  is the ability to see the number of social platforms refer the highest quality traffic to the brand’s website. GA has broken down social into its own referral traffic source, thereby giving digital marketers the ability to: see which networks send traffic; visualize visitor flow from social networks through the site; and identify which content is popular
  • How Social Media Affects Conversions: The power of social media lies in its ability to influence a conversion. Google’s Assisted Conversions and Assisted Conversion Value track sales and conversions where the social network assisted. In other words, you can see when someone visits your site, leaves without converting, and then returns later to convert.  


But What is Social Media Saying About Us?

While every effort to measure online activities – both within a website and around its brand in social media – is important, we can’t forget about how the general public views the brand. 

Social Media monitoring is an important part of every digital marketer. If a brand’s general influence is low or negative, then no amount of advertising will help gain business. Platforms like Radian6 or Sysomos measure a brand’s online health and position against its competitors.

These listening tools measure how people engage with one another when mentioning your brand, your competitors and/or your industry. With this information, brands can paint a clear picture of what their audience looks like, what they’re saying about you and more importantly, how you can tailor your integrated marketing efforts.

References:
Companies spending more on web analytics: survey. (2010, June 09). Retrieved from http://econsultancy.com/us/blog/6045-companies-spending-more-on-web-analytics-survey

(2011). Puma kicks up order rate 7% with insights from google analytics and viget. Google Analytics. DOI: PUMA Kicks Up Order Rate 7% with Insights from Google Analytics and Viget

Using google analytics social reports to measure your website content and engagement in google [Web log message]. (2012, April 23). Retrieved from http://analytics.blogspot.com/2012/04/using-google-analytics-social-reports.html

Monday, July 2, 2012

Goals, Funnels and Filters: Interpreting Key Measurement Tools


As digital marketers, one of our pain-staking jobs is to report, measure, analyze and provide insight on the successes of websites. And one of our biggest tools of the trade, Google Analytics (GA), provides the various components to measuring that success.

This week, I explored the various ways of segmenting traffic and how their behavior is affected by the various tactics being implemented. Some key tools are Goals, Funnels and Filters.
In case you didn’t know, here are brief descriptions of the various components of GA I will be discussing:
  • Goals: Web site page that helps generate conversions for your site (a ‘thank you page’, purchase confirmation page, an ‘about us’ page, etc.) (Wells, 2012)
  • Funnel: This represents the path you expect visitors to take on their way to converting to the goal (Wells, 2012).
  • Filters: These are applied to the information coming into your GA platform. This allows users to manipulate data so you can breakdown and segment your audience based on a variety of parameters (traffic from domains; traffic from IP addresses; etc.).
Now that we’ve discussed the components, let’s get down to business. Since the blog is meant to function as a channel to disseminate content, goals were developed to account for traffic visiting any blog post for a given timeframe. As you can see from the screenshot below, the blog has had 76 pageviews with visitors spending well over four minutes during each visit, leading to a zero percent bounce rate. This, of course, is due to the small number of visitors the page has reached (17 visits).
For the blog, the following goals were set:
  • Visit Duration: two goals were set measuring time on site – one minute and three minutes
  • Pages/Visit: a goal was set to measure a goal met when a visit accounts for viewing more than 2 pages
Since the blog’s purpose is not to generate sales (eCommerce), a value was not given to these goals. This doesn’t mean that a blog has to sell products/services to have a value. 

Measuring ROI can benefit some bloggers greatly in how they sell their blog to media, PR professionals, etc. Case in point, a popular blogger wants to sell content space on his blog and must show that there is value in his content, which generates traffic, to get advertisers to buy media space.

Evaluating Goal Conversions

Based on the data accounting for the last 30 days, the blog only converted two goals a total of four times. This largely correlates to the goal’s standards being set too high for a blog with little traffic and fewer than 10 blog posts. It is unlikely for the average consumer of digital media to spend more than three minutes on a site, given the average length of the blog posts. Further, since the blog has fewer than 10 blog posts, it is unlikely for the average visitor to view more than two pages. 

As you can see from the Goal Flow, visits came to the blog and of the total visits, only 5 managed to stay on the blog for longer than three minutes (both returning and unique visitors). Of this 5, they managed to view two pages: the index page (homepage of the blog) and a blog post about referral sources.

The benefit of measuring goals is to set actions you want people to take and identify areas of improvement. “Every time your user takes one of these actions, it’s a conversion. A visitor becomes a subscriber, a subscriber becomes a customer (sometimes, a visitor becomes a customer), and so on ("Tracking your blog," 2012). And various goals can be created, from newsletter sign-ups and downloads, to blog comments or RSS Feed followers. 

With that said, I added another goal to track completions after one minute. This should increase the quantity of goals being converted without giving up quality. This will also give me a better picture of how people are interacting with the blog, and if traffic is coming from other sources where I share my content on (i.e., social media sites).

Tracking Conversions through the Funnel

That’s right; there is a funnel in GA. As mentioned earlier, the funnel breaks down the path visitors took to convert a goal. Since the goals were set rather high, the funnel has little depth. Less than 12 percent of visits converted goals. With the creation of the new goal mentioned above, an improvement in goals will likely occur.

Another key takeaway of goals is to track events occurring on a site. Events represent important actions on a website – in this case, my blog. Events are directly tied to elements on the blog and not reaching a certain page. So on my blog, I would be tracking sign-ups to RSS Feeds and/or downloads of any documents posted on the blog. 

To date, my priority has only been to track various pages being viewed and from where those interactions are coming from. As traffic and overall audience size grows, I will add specific events to track key interactions that will further align my efforts.

References:
Tracking your blog goals with google analytics. (2012). Retrieved from http://unstuckdigital.com/tracking-goals-with-google-analytics/ 

Wells, M. (2012, May 21). Lesson 6: Successful approaches in google analytics . Retrieved from https://ecampus.wvu.edu/webct/urw/tp0.lc5116001/cobaltMainFrame.dowebct

Tuesday, June 26, 2012

Referral Sources is Key to Measuring Success

For those of you who don’t know, I created this blog for my graduate class, Web Metrics and SEO. In my professional career, I have worked with several analytics platforms, ranging from Sysomos and CoreMetrics, to Radian 6 and other free tools. Google Analytics (GA) has been one of the strongest tools, however, in providing the right insights for measuring success and seeking out areas of improvement. Perhaps one of the biggest measurements GA provides is traffic sources. This area says a lot about how your site is doing and how its efforts are turning visitors into customers.

Why Traffic Sources Matters

A brand’s traffic source directly correlates with its health and position across a variety of channels. For starters, referral traffic (a traffic source from another site) and direct traffic (URLs typed or bookmarked which visitors use directly to your site) have are two indicators of how a specified campaign or how much organic reach a brand has.

As Kaushik puts it, “Direct traffic contains visitors that proactively seek you out, everyone else you have to ‘beg’ to show up on your site!” (Kaushik, 2010).  He makes a strong point in that people who directly visit your site are:
  • People who are your existing customers or past customers and have bookmarked your site
  • People who are familiar with your brand
  • People driven by WOM (Word of Mouth)
  • People driven by offline campaigns (TV ads, OOH ads, etc.) and typed the URL directly
In other words, we want direct traffic because these people make up some of the strongest brand influencers who were motivated to visit your site directly over other competitors.

But let’s not forget about referral traffic. This, too, is an important part analytics. Referral traffic is a measurement of how a brand’s efforts are being voiced across third party sites. Users will come across some form of content, click on it and visit a brand’s site.

According to B2C, Referral traffic accounts for almost 70% of all traffic for blogger Andrew Glasscock.  He goes onto say that each of your top referrers can potentially be tapped for better referrals and higher traffic counts. “If you receive a lot of traffic from Google, perhaps you should advertise with their services and boost those numbers.”

Where Search and Social Come Into Play

Search is still, and will probably always be, the number one reason why people interact with the Internet. Having the right mix of SEO techniques and paid advertising campaigns is important in creating a consistent flow of search traffic. None of this is possible without attaining high rankings on a mix of keywords. 

GA’s search traffic tool identifies what keywords people are using most to visit a brand’s website. This information can be helpful in identifying how best to increase reach on those keywords while identifying areas of opportunity on keywords a brand wants to be known for.

The goal of Google, and all search engines for that matter, has been to deliver the most helpful and relevant information to users. According to Martin Wong, “Google’s success came from taking an approach that was radical in those early days: to curate for content quality by measuring the number of links to a page” (Wong, 2012). In other words, the more inbound links a page received, the greater their authority. This leads to a page having stronger content. Social media, however, evolves that mindset by incorporating social media into the mix. Tweets, Facebook likes and +1 vote are factors of how a page will rank against its competitors. 

Considering this and the importance of social, GA has made social its own traffic source, tracking social interactions and which social media channels they are coming from. According to Google, “The social web connects people where they share, critique and interact with content and each other. Social analytics provides you with the tools to measure the impact of social.” In other words, there is a high probability that a brand that is socially active and engaging will generate greater amounts of traffic and rank higher, over its competitors.

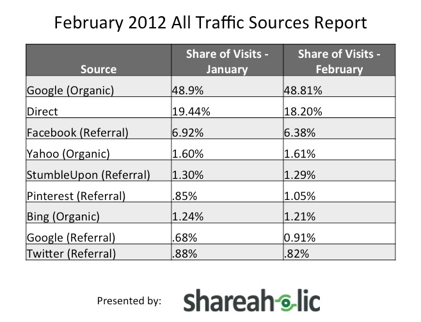
Knowing which social channels your audience interacts with is key for producing socially-driven campaigns. For example, Pinterest has been growing in popularity accounting and is now among the top referral sites, beating out Twitter, YouTube, Google+ and Linkedin (Crook, 2012).  


This drives brands to build a Pinterest campaign in order to drive traffic to their site.

Traffic Sources are Socially Impacts

Referral sources, simply put, are the culmination of all traffic visiting a brand’s site and knowing where they came from. This allows brands to identify and develop the right tactics that will lead to goals being met (lead acquisition, ecommerce transactions, etc.).

With social media having such a strong impact in how people search for information, Google has made great strides in taking into consideration the importance social media has. 

GA’s latest efforts to push Social into its own referral source is reason enough to pay attention to how social affects a brand’s reach. A brand’s social impact directly correlates with: (1) which pages and sources people engage with; (2) what information is being shared and leads to an ecommerce transaction, when applicable; (3) measuring what social engagements are occurring on your website (likes, shares, etc.); (4) and what kind of traffic patterns are directly related to social.

References:

Crook, J. (2012, March 8). Retrieved from http://techcrunch.com/2012/03/08/pinterest-now-generates-more-referral-traffic-than-twitter-study/

Glasscock. (2012, June 10). How to gauge your best referral traffic in google analytics. Retrieved from http://www.business2community.com/online-marketing/how-to-gauge-your-best-referral-traffic-in-google-analytics-0189880

Kaushik. (2010, September 20). Excellent analytics tip 18 make love to your direct traffic. Retrieved from http://www.kaushik.net/avinash/excellent-web-analytics-tip-analyze-direct-traffic/

Wong, M. (2012, February 29). How social media drives search results. Retrieved from http://www.marketingsmartt.com/social_drives_search/
 

Monday, June 4, 2012

ROI: Where Web Analytics and Social Media Meet

Everyone is always asking about ROI (Return on Investment) – and rightfully so. Marketers and their bosses need to see hard data that reflects how their efforts are gaining or losing business. When it comes to social media, it’s even more prevalent to know how social media campaigns are turning a profit for a brand.

An article posted on gigaom.com about 3 accurate metrics for ROI on social media campaigns discusses three distinct ways of measuring ROI:
  1. Social Media Revenue Conversion: “a measure of how many people become customers through social media referral channels.” In other words, web tracking allows for the measurement of referrals from various social media sites, either through traceable links or shared campaigns through third party apps (Wildfire App).
  2. Facebook engagement: “measures a brand’s ability to communicate successfully with their customers on the social network.” Similar to Google Analytics, Facebook Insights and a few other third party solutions tracks fan page engagement, content quality and overall sentiment
  3. Social customer support metrics: “measure the impact of customer support on brand health and the cost of staffing a social support program.” Along with the previous point, customer support is key to providing real time response to customer inquiries, which directly correlates with how successful a brand is in social media. The more positive the sentiment, the greater potential for growth. The more negative the sentiment, the greater potential for failure and a negative sentiment with a brand’s audience.

Google Analytics Now Measures Social Interactions

While there is no direct way to create a social media effort and it automatically track its profit, Google Analytics has done a great job in developing a tool for measuring Social.
 

Its latest update now has the ability to calculate the “social value”, primarily when goals are E-commerce based, through a myriad of metrics and calculations.  
 
Its new tools incorporate various tracking parameters to measure conversions from social actions (Likes, Tweets, Shares, Pins, referral source, etc.), which then provides a value to said social actions.

Calculating Social Value

ConvinceandConvert.com has a great article, which details the new tool and measuring social value. 

With pre-determined goals setup, a brand can see how conversions are valued from top funnel to bottom funnel of the sales pipe.

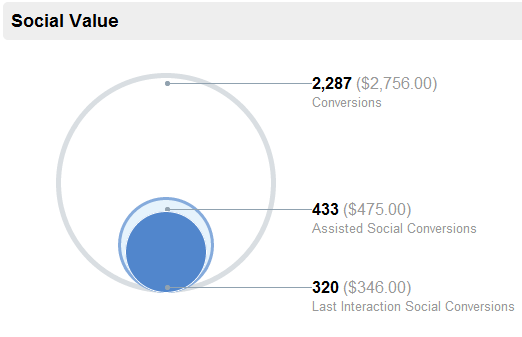
Google’s Social Report allows marketers to see the full social value generated from social channels. According to Google Analytics blog:

“Social Value visualization compares the number and monetary value of all your goal completions against those that resulted from social referrals - both as last interaction, and assisted.

A visit from a social referral may result in conversion immediately or it may assist in a conversion that occurs later on. Referrals that lead to conversions immediately are labeled as Last Interaction Social Conversion. If a referral from a social source doesn’t immediately generate a conversion, but the visitor returns later and converts, the referral is included as an Assisted Social Conversion.”
 
The biggest takeaway from web metrics and social media is how a brand implements the various tools to measure its successes and areas of improvement. 

What we want to avoid is developing RAMs (Random Acts of Marketing), which can be costly mistakes. Worse off, they are immeasurable and can prove to be a short-term solution to a long-term problem.

Any smart marketer’s first step is to research and identify the proper tools that can measure the various points of a marketing campaign. Then, take things off from there.